| Finite-Element Structural Analysis:
A New Tool for Bicycle Frame Design The Strain Energy Design Method by Leisha A. Peterson and Kelly J. Londry |
|
|

|
Tweet
Follow @sheldonbrowncom |
| Finite-Element Structural Analysis:
A New Tool for Bicycle Frame Design The Strain Energy Design Method by Leisha A. Peterson and Kelly J. Londry |
|
|
|
Tweet
Follow @sheldonbrowncom |
Scanned and OCR from:
Bike Tech
Bicycling Magazine's Newsletter for the Technical Enthusiast
SUMMER 1986 VOLUME 5, NUMBER 2
IN THIS ISSUE
DESIGN
The structural design tool called finite-elements analysis is
useful, even essential, for achieving optimum results with the
new composite materials (carbon, Kevlar). Of course, the method
can also be used for work with metals (steel, aluminum,
titanium). Leisha Peterson and Kelly Londry of Pegasus Research,
whose finite-elements analysis played a part in developing the
Trek 2000 frame, outline the method's application in bicycle
frame design.
Intuition and trial-and-error have played major roles in the evolution of today's diamond-shaped steel frames. The design and manufacture of bicycle frames has largely been an art, performed by skilled craftsmen; their efforts have resulted in reliable, efficient structures.
The limitations of trial-and-error become most apparent when new materials enter the picture, and when new applications and demands are placed on the structure. Now that bicycle framebuilders are using materials such as aluminum, magnesium, titanium, and fiber composites, a need exists to help the designer exploit the desirable properties of these materials. Trial and error is costly and slow, and intuition does not always yield reliable results. A promising solution is to turn to a proven tool of structural engineering: the finite-element analysis (FEA) method. The essence of FEA is to break a large stress analysis problem into many smaller ones, which are then collectively solved by computer. (A thorough treatment of FEA applications in the auto industry is given in Modern Automotive Structural Analysis, edited by M.M. Kamal and J.A. Wolf, Jr., New York, NY, Van Nostrand Reinhold Company, 1982, 460pp.)
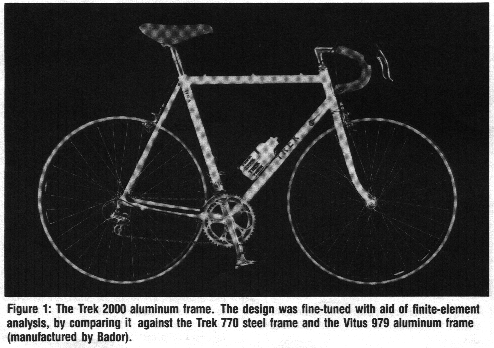
Figure 1: The Trek 2000 aluminum frame. The design was fine-tuned with aid of finite-element analysis, by comparing it against the Trek 770 steel frame and the Vitus 979 aluminum frame (manufactured by Bador).
![]()
![]()
The method has helped the U.S. auto manufacturers to stage their recent comeback, and it plays a major role in the design of almost all new airplanes, ships, bridges, and tall buildings built today. The bike industry is just beginning to realize the potential value of FEA for improved product design and a faster development cycle. And now that standard office microcomputers (IBM-PC variety) can handle the calculations for significantly large, complex models, more and more manufacturers and designers will start to use the method.
Finite-element analysis is usually used to fine-tune the geometry of a design that is still on the drawing board, before working models are built and tested. FEA is also used to debug an existing prototype. The first approach is more cost-effective and can open the door to more creative solutions at an early stage in the design process.
The design of the Trek 2000 aluminum frame offers a good example of how FEA works in practice. Here, the analysis was used to modify the design after Trek had built an early prototype. The frame material itself (high-tensile aluminum) and the joining method (adhesive bonding) were both relatively new to the bicycle industry, and Trek realized that necessary refinements would have been unacceptably slow and/or expensive if the traditional trial-and-error paths were followed blindly.
Our job, as consultants to Trek, was to improve the early prototype, using finite element analysis, with the goal of refining a frame design which performed at least as well as top-class steel frames of conventional design. The trial-and-error procedure was thus performed on the computer rather than on the shop floor, saving valuable development time.
Our overall approach to the project was to use the FEA tool to explore a wide range of trade-offs in frame design, and then to narrow the focus to a few options which would be most feasible for Trek to implement. This is the usual FEA approach in automotive and aircraft design work. A byproduct of this approach is that it lays the groundwork for future developments; Trek is now in a position to explore more radical designs and construction methods using FEA, with good assurance that reliable results will be obtained. The objectives of each stage of the work were as follows:
1) Construct a complete finite-elements model for the new frame design, as well as for two popular high performance frames: a Trek 770 (Reynolds 531C steel) and a Vitus 979 aluminum frame (manufactured by Bador of France), all of equal size (60 cm). The Trek 770 and the Bador frames are the "base cases" against which the new design was compared.
2) Apply a variety of loading conditions to all frames to calculate their response characteristics.
3) Identify which loading conditions are critical in the design, in terms of undesirable responses (high stresses, high deflections, etc.). Establish which loads may be safely ignored.
4) Look for relationships between strength, stiffness, and weight by studying (graphing, plotting, etc.) the output data from the previous steps. Seek intuitive insights from the data about each frame's structural character.
5) Recommend future designs, and apply the various critical load cases to gauge their performance.
Most of these objectives were met to a reasonable extent. Following is a more detailed account of how the FEA method works in practice.
![]()
![]()
The FEA modeling process requires three types of input data: geometry, material properties, and loading. For the bicycle frame, "geometry" means the overall frame dimensions (such as tube lengths, intersection points, and angles) as well as the tubing specifications (diameters, wall thickness, tapers, ovals, etc.).
Using the geometry data, a "pre-processor'' program subdivides the frame into a large number of small pieces (the so-called "finite elements") which accurately represent the various frame components (see Figure 2).

Figure 2: The finite-elements model is built by subdividing the frame into about 100 discrete beam elements. Boundary conditions are represented by restraints at rear axle and head tube.
For example, individual elements are assigned to represent such details as lugs, double-butting, and tapered tubing. For each element, mechanical properties such as cross-section area and principal moments of inertia are calculated by the pre-processor.
The models described here are all "beam models;" that is, each element in the model is what's called a three-dimensional Euler-Bernoulli beam. Thus, these elements can represent torsion, bending about two axes, and both axial and shearing deformations.
The more elements that are used in building the model, the better the resolution of localized stress/deformation patterns. But there is a trade-off here; calculations take much longer to complete as the number of elements increases. The beam models in this project used about 100 elements each.
The material properties needed for setting up the model include elastic modulus, shear modulus, Poisson ratio, and mass density. (Figure 3 lists material data pertinent to the Trek and Bador frames.)
| Frame | Material | Alloy | Young's Modulus (psi) | Poisson Ratio | Density (lb/in3) | Ultimate Tensile Strength (psi) | Elongation at Break | Fatigue Endurance Strength at 5*108 cycles (psi) |
|---|---|---|---|---|---|---|---|---|
| Trek 770 | steel | Reynolds 531 Competition | 30*106 | 0.29 | 0.28 | 112,000 | 10% | 60,000 |
| Trek 2000 | aluminum | True Temper T2 (similar to 7075-T6) | 10*106 | 0.33 | 0.10 | 82,000 | 11% | 24,000 |
| Vitus 979 (Bador) | aluminum | Duralinox (similar to 6061-T6) | 10*106 | 0.33 | 0.10 | 45,000 | 17% | 13,500 to 24,000 |
Strength-related properties (such as yield strength and elongation-at-break) are primarily used only after FEA, for evaluating the significance of internal stresses and identifying critical loads.
Finally, the externally acting loads must be specified in terms of magnitude, direction, and point of application on the frame. Loading information is derived from experiment, analytical deduction, and government standards. This information is then used to specify forces and moments acting at endpoints (nodes) of key elements such as dropouts, bottom bracket bearing, head tube, seat post, and brake bridges. (See figure 4.)

Correct loading information is absolutely vital in producing reliable results. In this study, a major effort was made to define a realistic and self-consistent set of load conditions. We will describe the load cases at some length since, in the bicycling industry at present, there is no accepted "standard load set" for designers to work with. We examined the following eight load cases as part of an investigation of the frames' overall safety and performance characteristics:
- Static Start-Up: A 150 pound rider is applying maximum effort to accelerate from a standing stop. The rider is "out of the saddle" and inertial effects are significant. Aerodynamic, rolling, and gyroscopic forces are assumed negligible. The bike is in vertical equilibrium with the front wheel pointed straight. Using published measurements of pedal loads and acceleration, the equations of static and dynamic equilibrium are solved to find chain, pedal, and handlebar loads. We find that loads generated in this case are very similar to those encountered in hill climbing.
- Horizontal Impact: Samples of every manufacturer's frame design must pass certain physical tests to comply with standards set in 1976 by the Bureau of National Affairs (BNA) and the Consumer Product Safety Commission. The BNA's "Requirements for Bicycles" manual calls for a single compressive loading test. A load of 980 Newtons (220 pounds) is applied to the front dropouts horizontally, with the rear dropouts constrained from any translational motion. The effect might be similar to a low speed, head-on collision into a wall or curb. To pass the test, there must be no "... visible evidence of fracture or frame deformation that significantly limits the steering angle over which the wheel can be turned".
- Vertical Impact: Vertical impact loads are represented by multiplying the rider's weight by a certain "G factor". For this study, three G's are used to simulate long-term road-vibration effects in the absence of pedaling forces. As a matter of interest, an object dropped from an infinitesimal height onto a rigid surface would exert a two-G impact load, assuming total energy transfer.
- Front-Wheel Braking: It is assumed that the front tire is skidding and thus front pitchover is imminent. Therefore, all weight is concentrated on the front wheel. Inertia loads caused by deceleration are included in the analysis. It is assumed that the rider applies no pedal loads during braking, and that all horizontal forces imparted by the rider are countered at the handlebars.
- Rear-Wheel Braking: Here it is assumed that the rear tire is skidding. Forces and moments imparted to the seatstays by friction reactions at the brake pads are taken into account. All other assumptions are similar to those of the front wheel braking case. There is some conjecture involved in these braking cases, because empirical measured data is lacking on some of the important variables.
- Steady-State Pedaling: This presents the most complex array of applied loads for any case under investigation. A 160 pound cyclist, seated on a 24-pound bicycle, is generating .54 horsepower (400 watts) at a cadence of 80 rpm. The front sprocket has 53T, the rear has 17T. It is assumed that forces due to leg dynamics may be neglected. Aerodynamic forces are also ignored since, at 25 mph, these forces are less than 10 pounds. Pedal forces and moments about the three principal axes are obtained from published test reports. The data allow a partial separation of the rider's mass and damping effect from the system's response. We treat the rider as an "inertia-less" rigid body which still applies its static weight. We then apply the equilibrium conditions at discrete time intervals (i.e. quasi-statically), to find the applied loads at seat, chain, dropouts, and handlebars. This requires the solution of seven simultaneous equations, plus an additional assumption that all horizontal pedal loads (parallel with the ground) are countered at the saddle. This assumption is arguable (because the exact distribution of loads depends on the rider's individual style), but it is not critical. In this study, the quasi-static pedal-load analysis was applied to the "worst case" situation: when the cranks are positioned at the maximum loading angle, approximately parallel with the ground.
- Klein Patent Tests: In Gary Klein's recently-issued patent [later overturned -- John Allen], two tests are defined as indicators of infringement: a lateral bending test and a bottom-bracket torsion test. These tests may have evaluation merit in their own right, but manufacturers also want to avoid legal problems. Thus, it may be important to know whether a proposed design violates patent claims before investing in its full development. Using FEA, these stiffness tests are simulated in advance. The tests call for applying loads to key frame locations, measuring local deflection, and then calculating an equivalent directional stiffness value. More on this later.
![]()
![]()
Once the input data for the FE model has been specified, the computer then solves a set of simultaneous linear equations for node displacements and internal element forces. The equations are similar to the well known single degree-of-freedom "spring equation:"
f = kx
, where:
f = applied axial force
k = axial spring constant
x = axial deflection
In the general FE model, the quantities of interest (loads, stiffnesses, and deflections) are represented in matrices:
[F]= [K][X]
, where:
[F] = vector of node forces and moments
[K] = element stiffness matrix
[X] = vector of node displacements (i.e. translations and rotations)
After solving for the unknown loads or displacements (usually several hundred or thousand unknowns), the internal stresses (torsion, axial loading, shear, and two-axis bending) in all the elements are calculated. In addition, the principal stress directions and strain energy values are found throughout the frame. The result is a "sea of numbers" which precisely describes the frame's state of stress under the given load condition.
One simple way to present the results of the analysis is to plot the frame geometry with the displacements highly magnified. Figures 5 and 6 show several such "deformed geometry" plots for the Trek 770 and Bador frames under some of the loads mentioned earlier.
Figure 5: Deflections in Trek 770 frame under various load conditions. Note the range in magnification factors. a. steady state cruising (25X). b. front wheel braking (10X). c. rear wheel braking (50X). d. vertical impact (50X). e. CPSC horizontal impact (10X).
Figure 6: Deflections in the Bador frame under the hill-climbing (start-up) load condition. (all 7.5X)
How is all of this information used? Essentially, it helps the designer to reach a good compromise in the frame's performance and strength characteristics. It is important to recognize the difference between strength and performance. Strength is the ability to sustain loading without failure. Performance means minimizing of weight and optimizing of stiffness attributes. In other words, the cyclist feels performance, but not strength. Only the lack of strength may be felt (i.e., frame failure). Thus, strength is a design constraint, As long as the frame is "strong enough", other variables which influence performance may be optimized for some desired purpose (track bike, mountain bike, etc.)
For safe design, the stress state in each frame element must fall within the material's "acceptable design strength" for all possible failure modes (static failure, fatigue, etc.) at that element. The finite-element analysis can easily calculate the element stresses for virtually any specified load condition. (Figure 7 shows Von Mises stress, also called "effective stress," in selected frame elements for the start-up load case, which produced the highest element stresses of the eight cases we analyzed.) Thus, the frame designer can check his work against whatever safety criteria must be met. These checks can be repeated at any time during the design process--for example, whenever a change is made in frame geometry or tubing dimensions--because the calculations are readily handled by the finite-elements program.

Figure 7: Stresses (ksi) in Trek 770 (above) and Bador (below) frames under start-up (hill-climbing) load condition. Note that highest stresses occur in lower part of seat tube.
An important safety concern in bicycle frame design is fatigue failure. When any material is subjected to repeated cyclic loads, its design strength must be decreased in certain prescribed ways, For steels, the design strength decreases until, at about one million stress-reversal cycles, a fatigue endurance limit is reached. The nominal strength does not decrease further from this minimum value, even if additional stress cycles occur. For steel alloys such as Reynolds 531, the fatigue limit is approximately one-half the ultimate strength.
The aluminum alloys generally used in bicycle frames have no fatigue limit; a progressively smaller design strength must be used as the number of expected stress cycles increases. This means that aluminum alloys have considerably less fatigue strength than their ultimate tensile strengths would suggest.
For instance, aluminum 7075-T6 (similar to the True Temper T2 alloy used in the Trek 2900) has a fatigue strength of only 24 ksi at 500 million load cycles (a commonly used design life for bicycles), which is less than 1/3 of its ultimate tensile strength (80 ksi).
For these reasons, it is important for the designer to understand the loads that can occur during the entire life of the frame, and to apply appropriate fatigue strength criteria. For instance, fatigue strength values may need to be reduced further still to accommodate localized stress concentrations, inferior surface finishes, and combined loading effects. Finite element analysis proves to be helpful in investigating a design for potential fatigue problems, even though factors beyond the FEA-calculated stresses are involved. A complete treatment of the fatigue analysis, however, is beyond the scope of this report.
![]()
![]()
Once the safety criteria are met, work on optimizing frame performance begins. The challenge is to minimize weight without compromising frame stiffness (subject to strength and comfort requirements).
With the computer, it's quite easy to "experiment" by changing tube diameters and wall thicknesses in a trial-and-error fashion. A problem with this approach is that changing any one tube changes the stresses and deflections throughout the entire frame. (The reason is that the frame is statically indeterminate to a high degree; the load paths change as the structure is changed.) Thus, it's often difficult to discover just exactly which tube(s) should be changed in trying to progress toward the optimum. To deal with this problem, we developed the following technique.
One problem with plots of stresses or deformations is that they provide limited insight into the trade-offs between stiffness characteristics, internal load distributions, and weight reduction. Fortunately, there is another powerful evaluation method which reveals this elusive information. It is based on the true intent of a stiff frame - efficient energy transfer from the cyclist to the rear wheel. This implies the use of a strain energy minimization design policy.
The true intent of a stiff frame is to transfer energy efficiently from the cyclist to the rear wheel. This implies that the designer should minimize the amount of energy that goes into flexing (straining) the frame. Some of this strain energy might be recoverable (i.e., released in such a way as to add power to the rear wheel). But we know of no measurements that show how much is recovered. Thus, we assume that the best policy is to minimize strain energy absorption in the frame.
When a bicycle frame deflects under load application, work is done on the frame, resulting in the frame's storage of human energy. A simple example is a linear spring compressed by an axial force. The stored energy is then equal to one half the applied force times the displacement of its application point, in the direction of deflection:
E=1/2(f)(x)
, where:
f = applied force
x = displacement from rest position
Recalling that force and deflection are related through stiffness (f = kx, from equations above), the strain energy equation may be re-written to show the influence of stiffness, k, on energy storage:
E = 1/2kx2
E = 1/2f2/k
If two different springs are subjected to equal forces, the stiffer spring will store less energy. This same principle also applies in a complex structure like a bicycle frame. For the frame, it is possible to calculate the strain energy stored in each element by using the matrix analogues of the energy equations immediately above. We have found that this distribution of energy within the frame is a useful indicator of its overall stiffness profile. We have also found that the concept of minimizing a frame's total energy storage is a helpful tool in designing for optimum performance.
Thus, the FEA method complements empirical load-deflection tests, such as the Klein patent test, which serve well for an overall evaluation of existing frames, but do not provide sufficient detailed data to show which frame components may need to be changed to improve frame performance.
We offer the following observations relating energy principles to frame design:
1) "Frame stiffness" cannot be specified by a single number in the same way that, for example, weight can. Rather, one frame has "many stiffnesses," a consequence of the matrix ( [k] ) representation in the finite-element model. In other words, frame stiffness is a directional quantity, and thus it is preferable to speak of "directional stiffness" and to specify the directions of applied force and displacement when using the term.
2) Strain energy, however, is scalar (non-directional), and therefore may be expressed by a single, absolute number. This provides a convenient figure-of-merit by which alternative frame designs may be compared. Further, the amount of strain energy absorbed by each element may be expressed as a percentage of the total, allowing each member's own significance to be understood. In short, energy distribution reflects, in a non-directional manner, the influence of directional stiffness characteristics.
3) A good frame design does not attempt to maximize stiffness in every direction. Rather, a good design tailors the interrelations between stiffness, internal load paths, and loading range, while aiming to achieve the lowest possible energy storage for a given weight.
A close look at the Trek 770 will clarify these points. Figure 8 shows the strain energy pattern within each tube of the Trek 770, for four loading cases.
Figure 8: Strain Energy absorbed in each frame tube of Trek 770.
First, note that the start-up (or hill-climbing) load generates the highest level of energy storage. The energy stored here (79.5 in-lb) represents about 4.0 percent of the rider's total energy output under typical hill-climbing conditions. This might sound like a small percentage, but in racing situations, even a slight reduction in this percentage would be noticed.
Consider now the significance of the other load cases. The cruising condition has much lower energy losses than the hill-climb case: 3.26 in-lb versus 79.5 in-lb. In the 3G vertical impact case, the strain energy is a mere 1.42 in-lbs. We draw the conclusion that, for the sake of rider comfort, energy losses in the vertical direction could be increased with little negative effect on climbing performance. In other words, the new 2000 frame design could aim for greater vertical in-plane flexibility than the 770 had.
The patterns in which the total energy is distributed among each frame tube are also interesting. For example, the seatstays absorb most of the vertical impact loads, but they do not play a major role in the other cases. Since vertical impact is not a significant factor in overall performance, the seatstays thus become prime candidates for shedding excess material (subject to strength constraints).
Another observation pertains to the three main tubes. For the cruising condition, energy losses are well balanced among them. But the down tube consumes almost 50% of the total strain energy in the start-up condition. This could be attributed to the out-of-saddle riding position that we assumed for this case. Thus, these numbers support the idea of designing different frames to suit different riders' styles (for example, those who sit versus those who stand for hill climbing, or those who "hammer" versus those who "spin" on the straightaway).
We are now in a position to review all three frame designs. In Figure 9, the strain energy absorbed by each tube in the Trek 770, Trek 2000, and Bador frames is plotted, for the start-up load case.
Figure 9: Strain Energy absorbed in the Trek 770, Trek 2000, and Bador frames in start-up (hill-climbing) load case.
This graph clearly shows the contribution each tube makes to the frames' overall performance.
This data is further broken down in Figure 10, which lists the percentage of strain energy accounted for by each of the four modes of deformation (axial loading, bending out of the plane of the frame, in-plane bending, and torsion).
Figure 10: Strain Energy in each frame tube, apportioned to the four modes of deformation. Start-up (hill-climbing) load case. A. TREK 2000 FRAME B. TREK 770 FRAME C. BADOR (VITUS 979) FRAME
Some important observations are:
- The down tube is always the greatest energy absorber. It stores between 38% and 49% of the total. Of this, between 58% and 66% is due to torsion. The remainder is due to out-of-plane bending. In-plane bending and axial loading are insignificant.
- The seat tube is the second highest energy absorber. It stores between 19% and 25% percent of the total. Most of this (between 79% and 84%) is due to out-of-plane bending, while 15% to 20% is due to torsion. Again, in-plane bending and axial loading are insignificant.
- The top tube stores between 10% and 13% of the total energy. Between 49% and 58% of this is due to out-of-plane bending. The remainder is due to torsion. In-plane bending and axial loading are insignificant.
- The two chainstays together account for 9% to 13% percent of the total energy. Out-of-plane bending accounts for 22% to 38% of this, while in-plane bending is between 12% and 21%. Note that these bending trends oppose the traditional use of elliptical chainstays with the major axis in the vertical direction. Torsion accounts for 28% to 62% of the energy storage. The apparent wide range of percentages here stems from the different loads encountered on the left and right sides. Perhaps asymmetrical chainstays should be used.
- Considering that in-plane bending is so insignificant in this important load case, the structural inefficiency of aerodynamic tubing becomes apparent. (Aero tubing has greater in-plane bending stiffness than out-of-plane.)
- Considering the high percentage of out-of-plane bending losses in the seat tube, it would make sense structurally to redesign this tube. One possibility is to use an out-of-plane elliptical cross-section, but this poses aerodynamic questions. Another possibility is for manufacturers to produce round-OD tubes with internal reinforcing ribs running the length of the tube, something like the butted sections of Columbus SLX and SPX tubing.
The final conclusions are given in the plot of weight versus strain energy in Figure 11 (data is from Figure 9). The Trek 2000 is clearly the stiffest frame of the three, since it is lowest in strain energy absorption. In addition, it is lighter than the Trek 770 and almost as light as the Bador. The Bador is the most flexible frame, since it is highest in strain energy storage.

Figure 11: Frame Weight versus Strain Energy for start-up load case.
The conclusions of this study are all in good agreement with rider perceptions, and perhaps offer few surprises to the experienced frame designer. What, then, is the value of the FEA method? Speed, for one thing. Physical testing at the level of detail described here would take many times longer than the computer calculations. More important, the groundwork is now laid for future explorations with new materials. In particular, frame design with fiber composites, with their highly directional properties, should be much simpler with the FEA method than by trial and error.
Leisha Peterson and Kelly Londry are partners in Pegasus Research Company, a firm specializing in computer-aided engineering services for the bicycle industry. They also consult on CAD applications for automobile and aircraft design. They both hold M.S. Mechanical Engineering degrees from Univ. of Michigan at Ann Arbor. They have built a number of human-powered vehicles for competition in the IHPI/A trials, including the 4-rider "Fusion" machine which finished first in its class in 1984. Currently, they are developing BikeCAD, an automated, microcomputer-based structural design program for manufacturers of bicycle frames and components.
Pegasus Research Company
Mechanical Dynamics Building
3055 Plymouth Head
Ann Arbor, MI 48105
USA
313-996-3923
The authors wish to thank Mr. Bevil Hogg, President of Trek Bicycle Company, and Dr. Bitthal Gujrati, Engineering Director, for their cooperation in the preparation of this article.
Copyright © 1995-2001
![]()
![]()
Last Updated: by Harriet Fell